How the logistic regression model works

Logistic Regression Model
How the Logistic Regression Model Works in Machine Learning
In this article, we are going to learn how the logistic regression model works in machine learning. The logistic regression model is one member of the supervised classification algorithm family. The building block concepts of logistic regression can be helpful in deep learning while building the neural networks.
Logistic regression classifier is more like a linear classifier which uses the calculated logits (score ) to predict the target class. If you are not familiar with the concepts of the logits, don’t frighten. We are going to learn each and every block of logistic regression by the end of this post.
Before we begin, let’s check out the table of contents.
Table of Contents
- What is logistic regression?
- Dependent and Independent variables?
- Logistic regression examples.
- How the logistic regression classifier works.
- Binary classification with logistic regression model.
- What is Softmax function?
- The special cases of softmax function.
- Implementing the softmax function in Python.
So let’s begin.
How the Logistic Regression Model Works in Machine Learning. Click To TweetWhat is logistic regression?
Below is the most accurate and well-defined definition of logistic regression from Wikipedia.
“Logistic regression measures the relationship between the categorical dependent variable and one or more independent variables by estimating probabilities using a logistic function” (Wikipedia)
Let’s understand the above logistic regression model definition word by word. What logistic regression model will do is, It uses a black box function to understand the relation between the categorical dependent variable and the independent variables. This black box function is popularly known as the Softmax funciton.
Dependent and Independent Variables
The dependent and the independent variables are the same which we were discussed in the building simple linear regression model. Just to give you a glance. The dependent variable is the target class variable we are going to predict. However, the independent variables are the features or attributes we are going to use to predict the target class.
Suppose the shop owner would like to predict the customer who entered into the shop will buy the Macbook or Not. To predict whether the customer will buy the MacBook or not. The shop owner will observe the customer features like.
- Gender:
- Probabilities wise male will high chances of purchasing a MacBook than females.
- Age:
- Kids won’t purchase MacBook.
The shop owner will use the above, similar kind of features to predict the likelihood occurrence of the event (Will buy the Macbook or not.)
In the mathematical side, the logistic regression model will pass the likelihood occurrences through the logistic function to predict the corresponding target class. This popular logistic function is the Softmax function. We are going to learn about the softmax function in the coming sections of this post.
Before that. Let’s quickly see few examples to understand the sentence likelihood occurrence of an event.
Examples of likelihood occurrence of an event
- How likely a customer will buy iPod having iPhone in his/her pocket.
- How likely Argentina team will win when Lionel Andrés Messi in rest.
- What is the probability to get into best university by scoring decent marks in mathematics, physics?
- What is the probability to get a kiss from your girlfriend when you gifted her favorite dress on behalf of your birthday?
Hope the above examples gives you the better idea about the sentence predict the likelihood occurrence of an event.
Before drive into the underline mathematical concept of logistic regression. let’s brush up the logistic regression understanding level with an example.
Logistic Regression Model Example


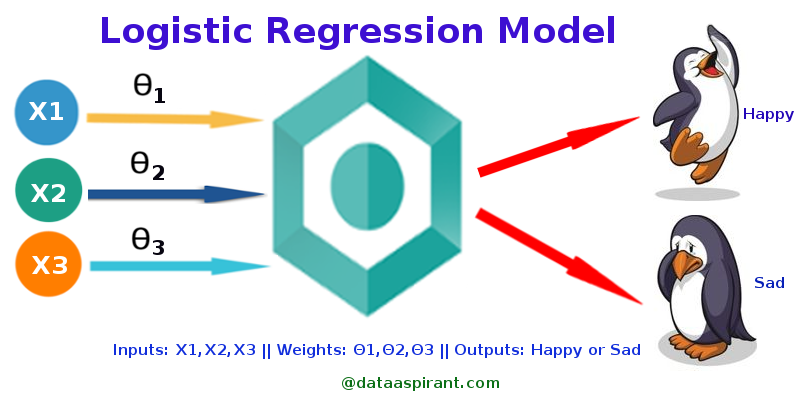
logistic Regression Example
Suppose HPenguin wants to know, how likely it will be happy based on its daily activities. If the penguin wants to build a logistic regression model to predict it happiness based on its daily activities. The penguin needs both the happy and sad activities. In machine learning terminology these activities are known as the Input parameters ( features ).
So let’s create a table which contains penguin activities and the result of that activity like happy or sad.
| No. | Penguin Activity | Penguin Activity Description | How Penguin felt ( Target ) |
|---|---|---|---|
| 1 | X1 | Eating squids | Happy |
| 2 | X2 | Eating small Fishes | Happy |
| 3 | X3 | Hit by other Penguin | Sad |
| 4 | X4 | Eating Crabs | Sad |
Penguin is going to use the above activities ( features ) to train the logistic regression model. Later the trained logistic regression model will predict how the penguin is feeling for the new penguin activities.
As it’s not possible to use the above categorical data table to build the logistic regression. The above activities data table needs to convert into activities score, weights, and the corresponding target.
Penguin Activity Data table
| No. | Penguin Activity | Activity Score | Weights | Target | Target Description |
|---|---|---|---|---|---|
| 1 | X1 | 6 | 0.6 | 1 | Happy |
| 2 | X2 | 3 | 0.4 | 1 | Happy |
| 3 | X3 | 7 | -0.7 | 0 | Sad |
| 4 | X4 | 3 | -0.3 | 0 | Sad |
The updated dataset looks like this. Before we drive further let’s understand more about the above data table.
-
Penguin Activity:
- The activities penguin do daily like eating small fishes, eating crabs .. etc
-
Activity Score:
- The activity score is more like the numerical equivalent to the penguin activity. For eating squids activity, the corresponding activity score is 6 and likewise, for other activities the scores are 3, 7, 3.
-
Weights:
- The Weights more like the weightages corresponding to the particular target.
- Suppose for the activity X1 we have the weight as 0.6.
- It means to say if the penguin performs the activity X1 the model is 60% confident to say the penguin will be happy.
- If you observe the weights for the target class happy are positive, and the weights for the target class sad are negative.
- This is because the problem we are addressing a binary classification. Will talk about the binary classification in the next sections of this post.
-
Target:
- The target is just the binary values. The value 1 represents the target Happy, and the value 0 represents the target Sad.
Now we know the activity score for each activity and the corresponding weights. To predict how the penguin will feel given the activity we just need to multiply the activity score and the corresponding weight to get the score. The calculated score is also known as the logits which we talked earlier in the post.
The logit (Score) will pass into the softmax function to get the probability for each target class. In our case, if we pass the logit through the softmax function will get the probability for the target happy class and for the target sad class. Later we can consider the target class with high probability as the predicted target class for the given activity.
In fact, we can predict whether the Penguin is feeling happy or sad with the calculated logits (Score ) in this case. As we were given the positive weights for the target class happy and the negative weights for the target class sad. We can say If the Logit is greater than 0 the target class is happy and if the logit is less than 0 the target class is sad.


Logistic regression model for binary classification
Binary classification with Logistic Regression model
In the Penguin example, we pre-assigned the activity scores and the weights for the logistic regression model. This won’t be the simple while modeling the logistic regression model for real word problems. The weights will be calculated over the training data set. Using the calculated the weights the Logits will be computed. Till here the model is similar to the linear regression model.
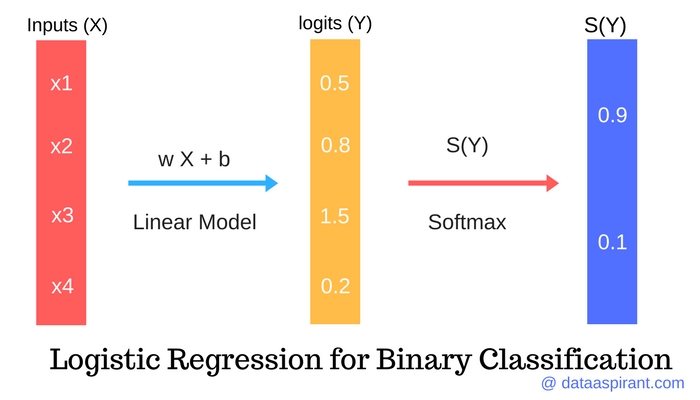
Note: The Logits in the image were just for example, and not the calculated logits from the penguin example
The calculated Logits (score) for the linear regression model will pass through the softmax function. The softmax function will return the probabilities for each target class. The high probability target class will be the predicted target class.
The target classes In the Penguin example, are having two target classes (Happy and Sad). If we are using the logistic regression model for predicting the binary targets like yes or no, 1 or 0. which is known as the Binary classification.
Till now we talk about the softmax function as a black box which takes the calculated scores and returns the probabilities. Now let’s learn how the softmax function calculates the probabilities. Next, we are going to implement the simple softmax function to calculate the probabilities for given Logits (Scores)
What is Softmax function?


Softmax function
Softmax function is the popular function to calculate the probabilities of the events. The other mathematical advantages of using the softmax function are the output range. Softmax function output values are always in the range of (0, 1). The sum of the output values will always equal to the 1. The Softmax is also known as the normalized exponential function.
The above is the softmax formula. Which takes each value (Logits) and find the probability. The numerator the e-power values of the Logit and the denominator calculates the sum of the e-power values of all the Logits.
Softmax function used in:
- Naive Bayes Classifier
- Multinomial Logistic Classifier
- Deep Learning (While building Neural networks)
Before we implementing the softmax function, Let’s study the special cases of the Softmax function inputs.
The special cases of softmax function input
The two special cases we need to consider about the Softmax function output, If we do the below modifications to the Softmax function inputs.
- Multiplying the Softmax function inputs (Multiplying the Logits with any value)
- Dividing the Softmax function inputs (Dividing the Logits with any value)
Multiplying the Softmax function inputs:
If we multiply the Softmax function inputs, the inputs values will become large. So the logistic regression will be more confident (High Probability value) about the predicted target class.
Dividing the Softmax function inputs:
If we divide the Softmax function inputs, the inputs values will become small. So the Logistic regression model will be not confident (Less Probability value) of the predicted target class.
Enough of the theoretical concept of the Softmax function. Let’s do the fun part (Coding).
Implementing the softmax function in Python
Let’s implement a softmax function which takes the logits in list or array and returns the softmax function outputs in a list.
# Required Python Packages
import numpy as np


def softmax(scores):
    """
    Calculate the softmax for the given scores
    :param scores:
    :return:
    """
    return np.exp(scores) / np.sum(np.exp(scores), axis=0)

scores = [8, 5, 2]

if __name__ == "__main__":
    logits = [8, 5, 2]
    print "Softmax :: ", softmax(logits)
To implement the softmax function we just replicated the Softmax formula.
- The input to the softmax function is the logits in a list or array.
- The numerator computes the exponential value of each Logit in the array.
- The denominator calculates the sum of all exponential values.
- Finally, we return the ratio of the numerator and the denominator values.
Script Output:
Softmax :: [ 0.95033021 0.04731416 0.00235563]
Summary
In this post, we learned about the logistic regression model with a toy kind of example. Further, we learned about the softmax function. Finally, we implemented the simple softmax function with takes the logits as input and returns the probabilities as the outputs.
Follow us:
FACEBOOK| QUORA |TWITTER| GOOGLE+ | LINKEDIN| REDDIT | FLIPBOARD | MEDIUM | GITHUB
I hope you like this post. If you have any questions, then feel free to comment below. If you want me to write on one particular topic, then do tell it to me in the comments below.


So 0.9 will be the predicted class as it is having a high propability in the above image?
Even with Messi in the Argentina team, they couldn’t win.
Hi ConcernedReader.
Sometimes it happens 🙂
if we multiply weights with activity score, it will be 6*.6 = 3.6, 3*0.4 = 1.2 and so on and so forth. However, the logits are assigned 0.5,0.8, …. . What am I missing?
Hi Manjunath,
You said true. If we multiply the weights with activities the score should be 6* 0.6 = 3.6 likewise, But the example image is for explaining the binary classification with logistic regression which is different from the penguin example.
Thanks for asking. Will update the post with the clarification about the image.
Hi Manjunath,
Updated the post: Clarification about the binary classification with logistic regression image.