Four Most Popular Data Normalization Techniques Every Data Scientist Should Know

Have you ever tried to train a machine learning model with raw data and ended up with suboptimal results?
Or, have you ever encountered a situation where different features in your dataset have different scales, making it difficult to compare their relative importance?
You're not alone if you answered yes to either of these questions.
These are common pain points that arise when working with real-world data, and they can be addressed through a machine learning technique called data normalization.
Popular Normalization Techniques
Data normalization is the process of transforming data into a standard format that allows for fair comparisons between features and avoids issues with differing scales.
In this article, we'll explore the benefits of data normalization, best practices for implementing it, and its impact on machine learning model performance.
What is Data Normalization?
Data normalization is a fancy term that means making sure all your data is on a level playing field. Imagine you and your friend are having a race. You're both pretty fast, but there's a problem: you're wearing slippers, and your friend is wearing roller skates.


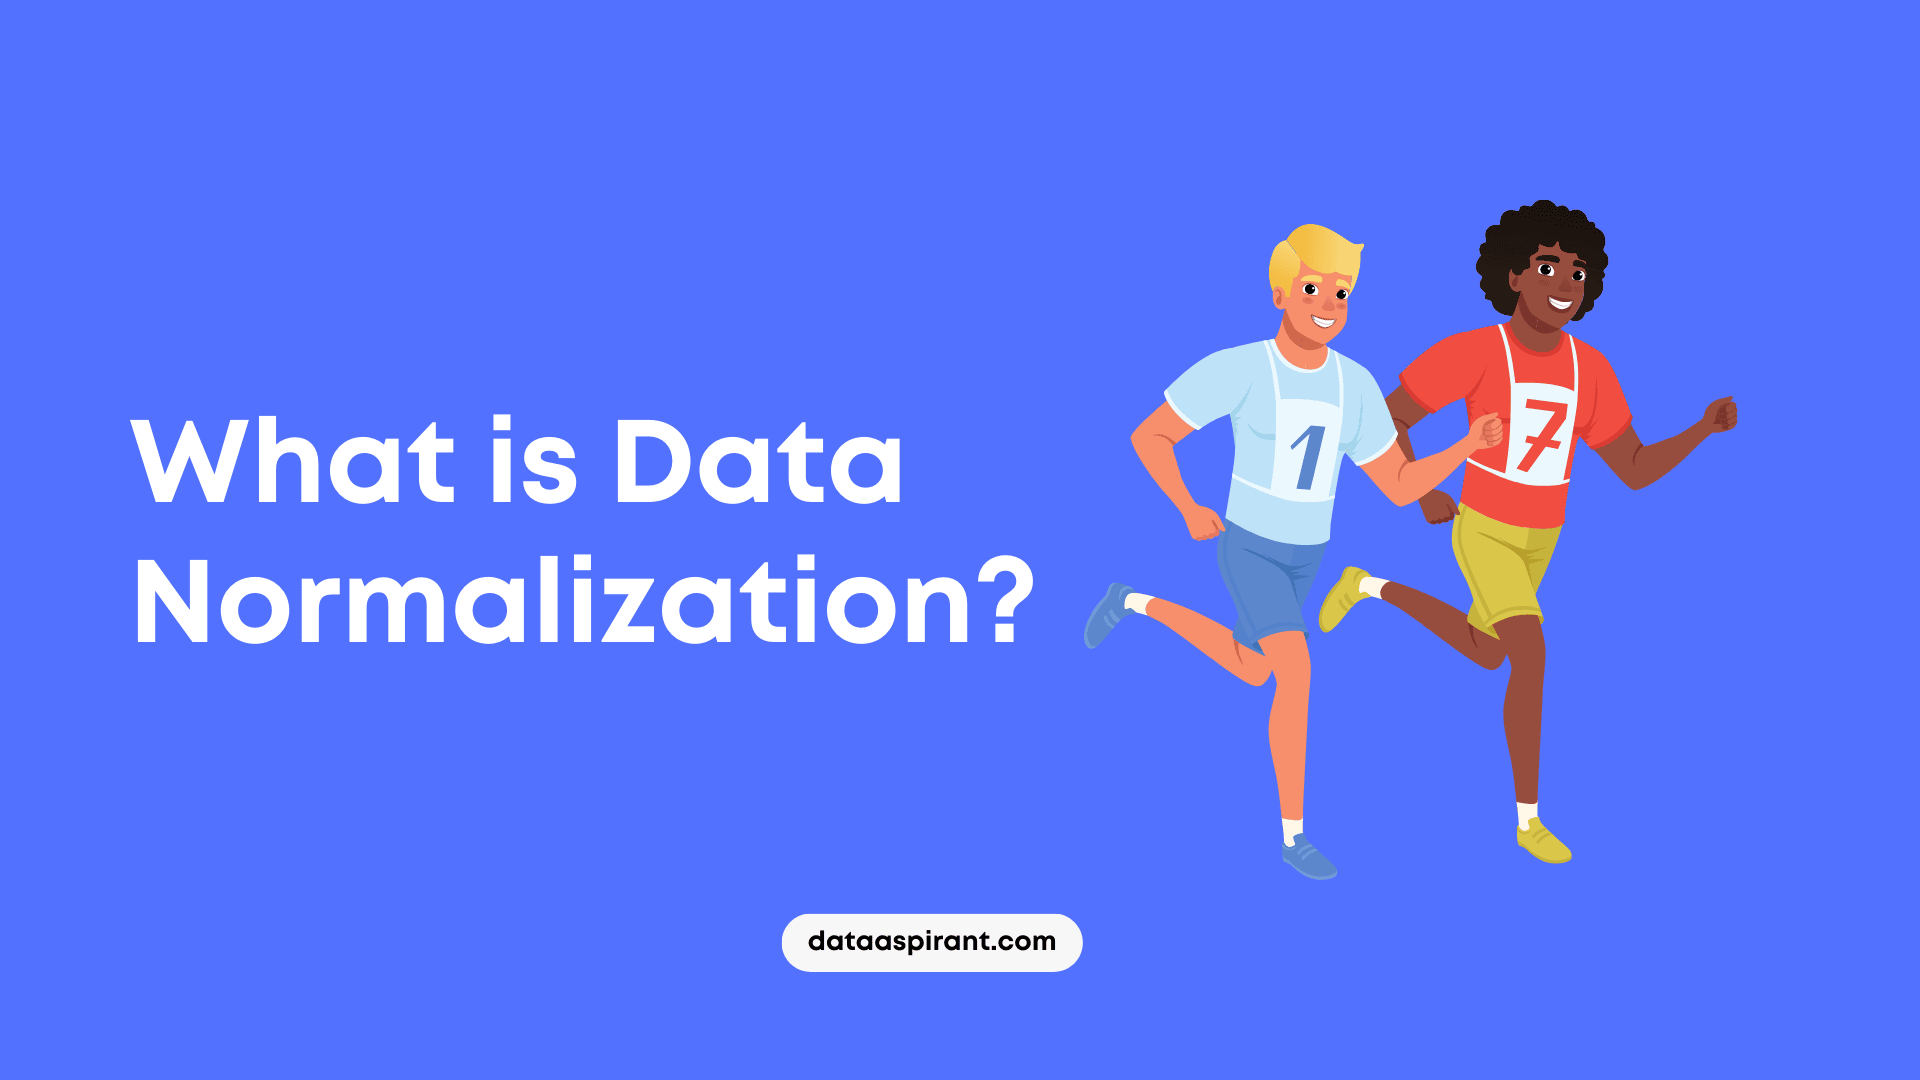

That's not fair, is it?
That's what can happen with data, too. You might have one column with numbers that go from 0 to 100, and another column with numbers that go from 0 to 1.
How can you compare those two columns if they're not even using the same scale?
It's like trying to compare apples to oranges.
That's where data normalization comes in. It's a way to adjust your data so that everything is on the same scale. You can do this by dividing each value in a column by the maximum value in that column or by subtracting the mean and dividing by the standard deviation.
Let's say you're trying to predict how much a house will sell for based on the number of bedrooms and bathrooms it has.
Without normalization, the number of bedrooms might range from 1 to 5, while the number of bathrooms ranges from 1 to 3.
That could be more helpful! But if you normalize the data, you can compare the two columns and see which one has a bigger impact on the price of the house.
Different Data Normalization Techniques


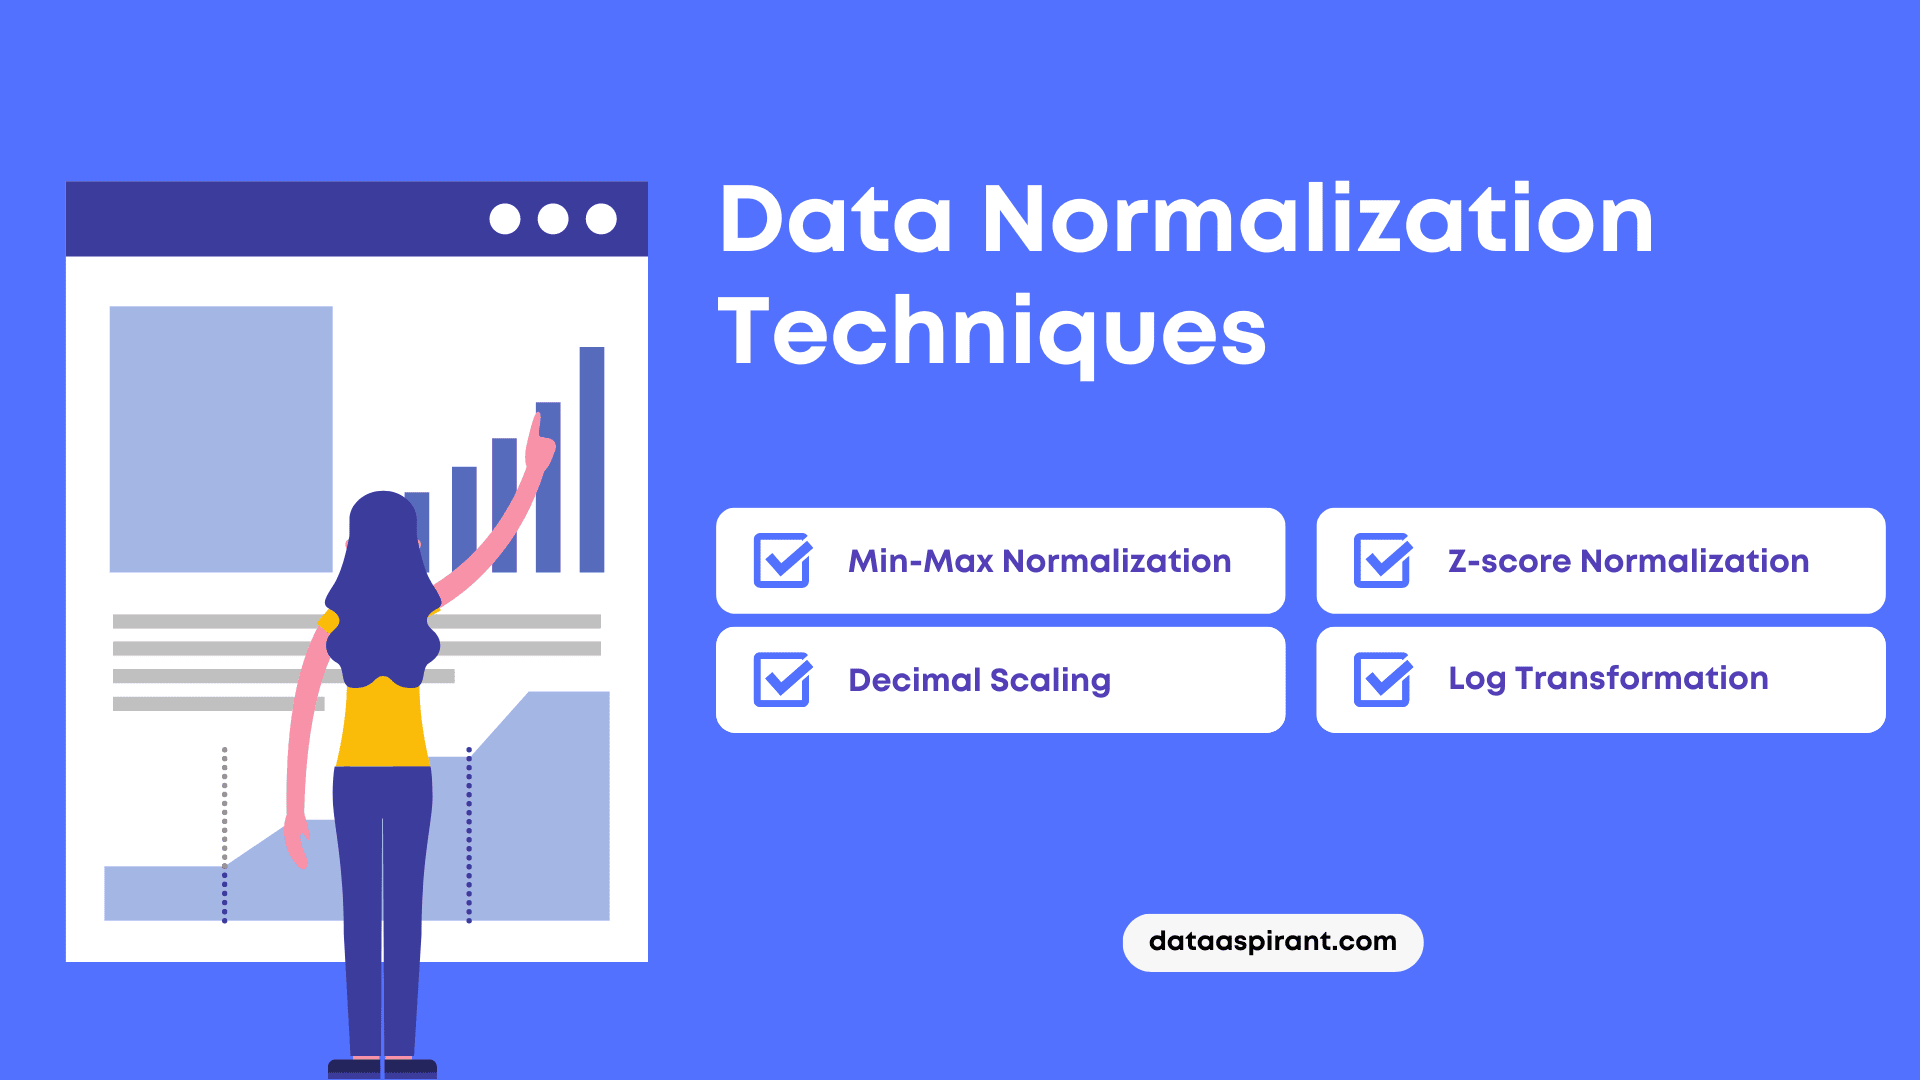

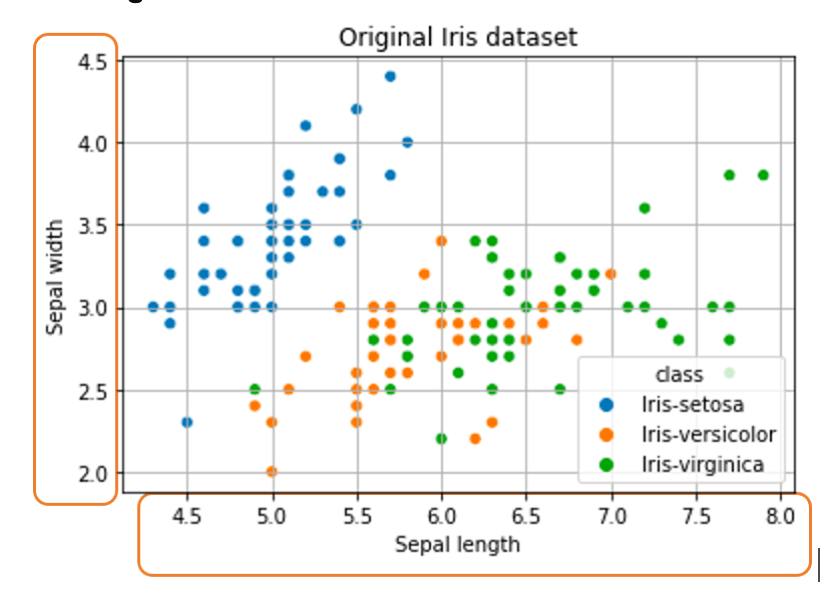
In this section, let’s understand various data normalization techniques and when they might be used! (observe how the scale [marked in orange boxes] of the value changes with different techniques)
The original distribution of data



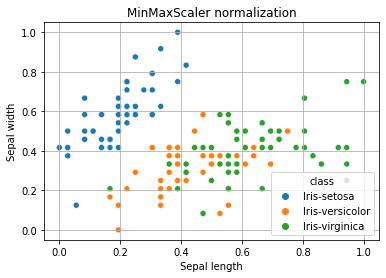
Min-Max Normalization
Min-Max normalization scales the data to a fixed range, typically between 0 and 1.
The formula for Min-Max normalization is Xnorm = (X - Xmin) / (Xmax - Xmin)
Where
- X is the original data point,
- Xmin is the minimum value in the dataset,
- Xmax is the maximum value in the dataset.
This technique is useful when you want to preserve the shape of the distribution and the exact values of the minimum and maximum. However, it is sensitive to outliers and may not work well if the dataset has extreme values.
Min-Max Normalization Implementation In Python



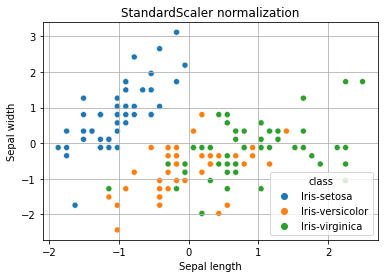
Z-score Normalization
Z-score normalization, also called Standardization, scales the data so that it has a mean of 0 and a standard deviation of 1.
The formula for Z-score normalization is: Xnorm = (X - mu) / sigma
Where
- X is the original data point,
- mu is the mean of the dataset,
- sigma is the standard deviation of the dataset.
This technique is useful when you want to compare data points across different datasets or when you want to identify outliers.
It's also robust to outliers since it's based on the mean and standard deviation of the dataset. However, it may not preserve the shape of the distribution and can make it difficult to interpret the original values.
Z-Score Normalization Implementation In Python



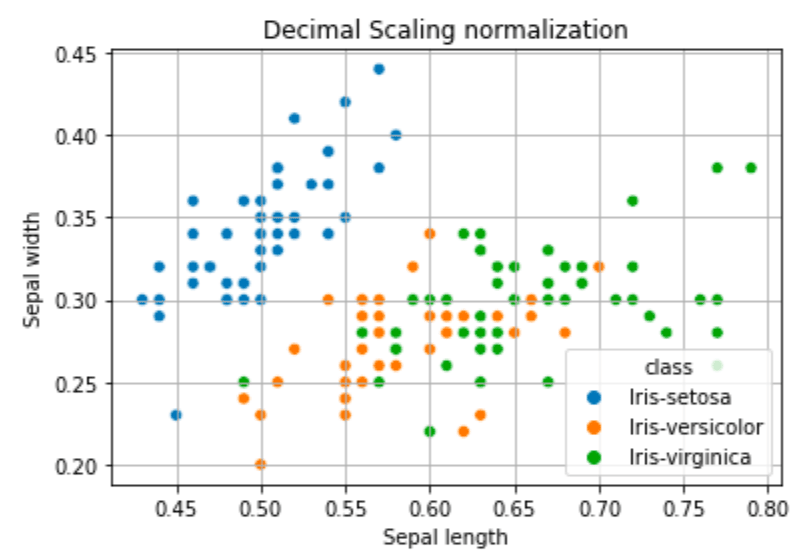
Decimal Scaling
Decimal scaling scales the data by multiplying it by a power of 10 to shift the decimal point to a fixed position.
The formula for decimal scaling is: Xnorm = X / 10^j,
Where
- X is the original data point
- j is the smallest integer such that max(|Xnorm|) < 1.
This technique is useful when you want to preserve the relative size of the values while simplifying the data. However, it may not work well with small datasets or datasets with extreme values.
Decimal Scaling Normalization Implementation In Python



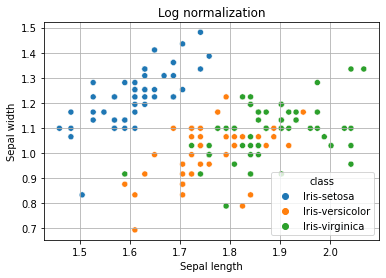
Log Transformation
Log transformation scales the data by taking the logarithm of the values. The formula for log transformation is: Xnorm = log(X)
Where X is the original data point.
This technique is useful when the data is skewed or has a heavy tail and when you want to compress a wide range of values into a smaller range. However, it may not work well with negative or zero values.
Log Transformation Implementation In Python



Which technique to use depends on the specific characteristics of the dataset and the problem you're trying to solve.
- Min-Max normalization is useful when you want to preserve the shape of the distribution and the exact values of the minimum and maximum.
- Z-score normalization is useful when you want to compare data points across different datasets or when you want to identify outliers.
- Decimal scaling is useful when you want to preserve the relative size of the values while simplifying the data.
- Log transformation is useful when the data is skewed or has a heavy tail, and when you want to compress a wide range of values into a smaller range.
Advantages and Disadvantages of Data Normalization


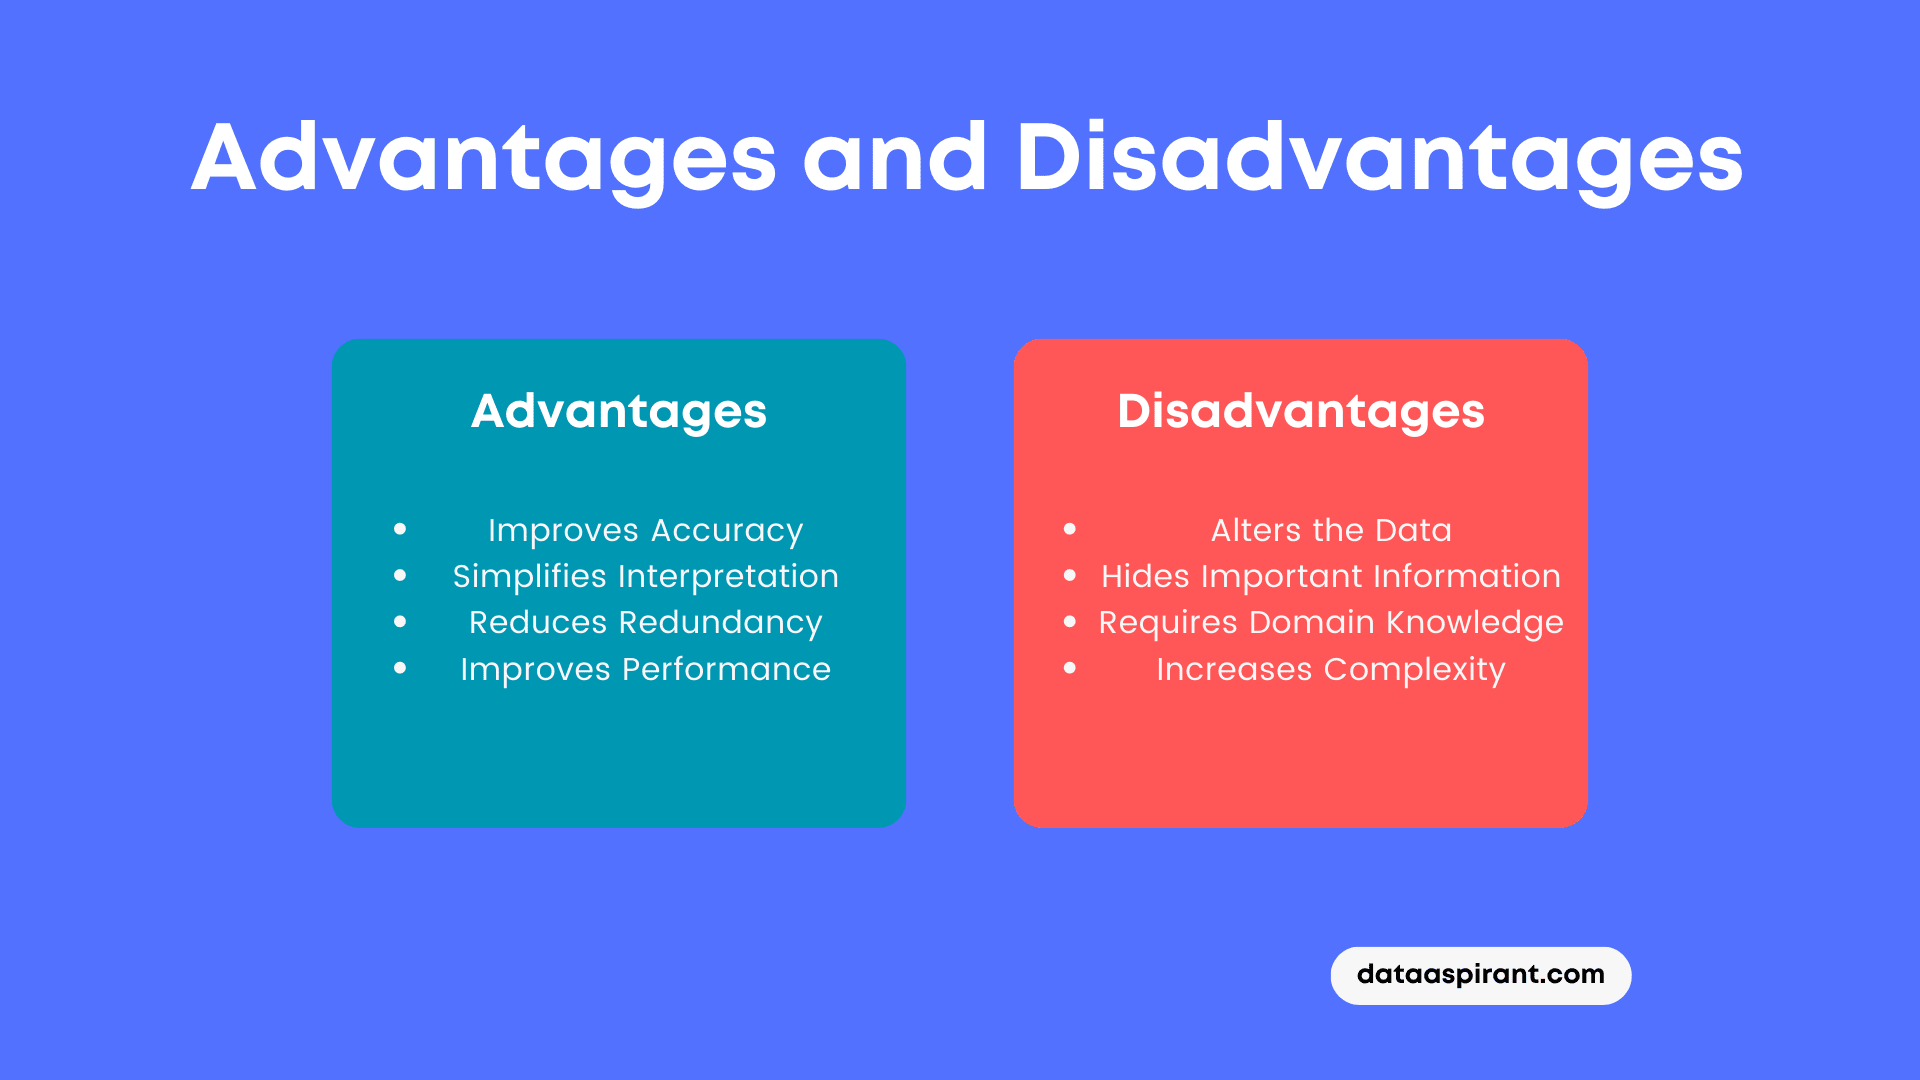

Advantages of Data Normalization:
Improves Accuracy: Normalizing the data can improve the accuracy of statistical analysis by ensuring that all values are on the same scale. This can prevent one variable from dominating the results.
Simplifies Interpretation: Normalizing the data can make it easier to interpret the results of statistical analysis because all the variables are on the same scale. This can make it easier to compare and contrast different variables.
Reduces Redundancy: Normalization can help reduce data redundancy by removing duplicate or unnecessary information. This helps streamline the analysis process and makes focusing on the important variables easier.
Improves Performance: Normalizing the data can improve the performance of machine learning algorithms by ensuring that the inputs are on the same scale. This can help to improve the accuracy of the model and reduce overfitting.
Disadvantages of Data Normalization:
Alters the Data: Normalizing the data can alter the data distribution, making it harder to interpret the results of statistical analysis. It can also make it harder to compare the results with other datasets.
Hides Important Information: Normalizing the data can sometimes hide important information in the data. For example, if there are outliers in the data, normalizing the data can make it harder to identify and remove them.
Requires Domain Knowledge: Choosing the right normalization technique requires domain knowledge and an understanding the dataset. Using the right technique can lead to accurate results.
Increases Complexity: Normalizing the data can increase the complexity of the analysis process. This can make it harder to understand the results and can increase the risk of errors in the analysis.
Where Is Data Normalization Used
It is a commonly used technique in various fields to ensure that data is consistent, accurate, and easy to interpret. Some real-world applications of data normalization are


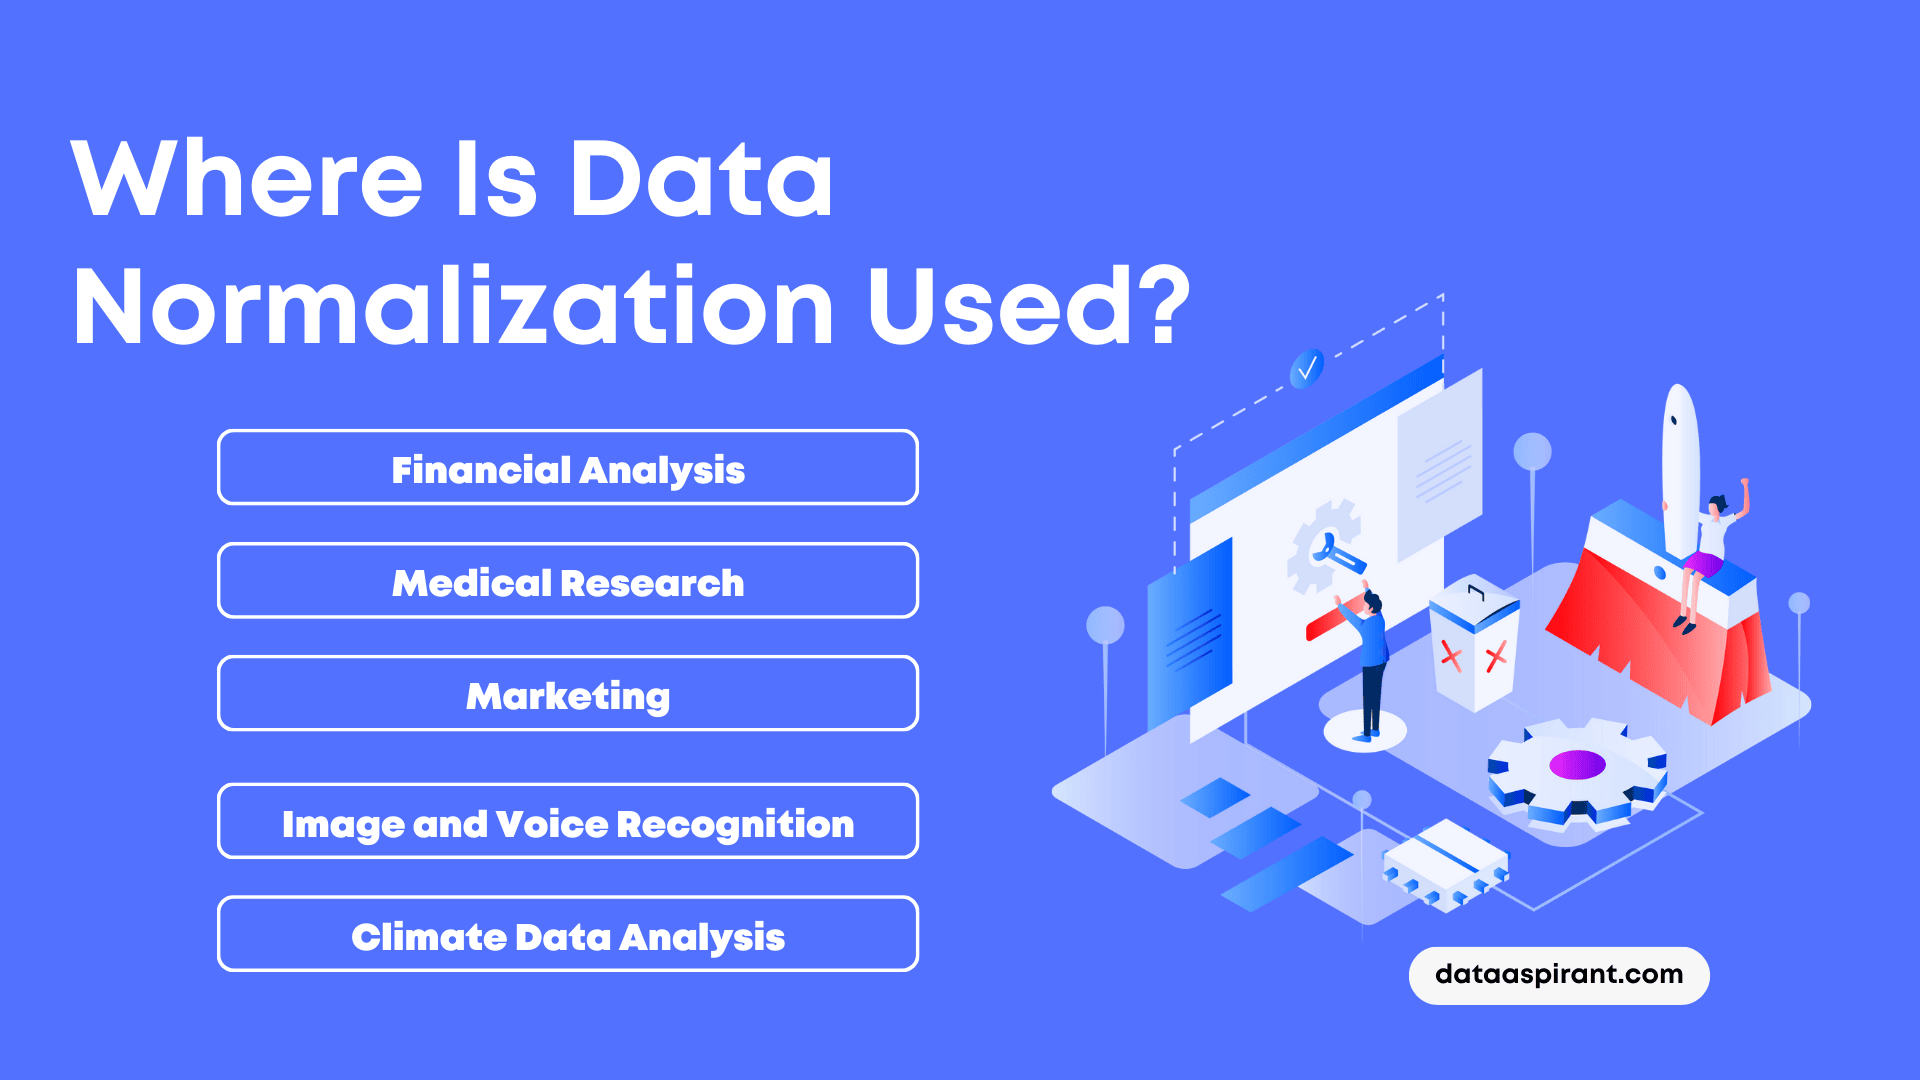

Financial Analysis
Data normalization is widely used in financial analysis to compare companies’ financial data, which can come from different sources, periods or units of measurement. It ensures that the data is on the same scale and allows for easy comparison of financial statements between different companies.
Medical Research
Normalizing medical data is important in research studies, where patient data from different sources may have different scales, for example, blood pressure readings taken in different units. Researchers can make more accurate comparisons and identify trends by normalising the data.
Marketing
Data normalization is used to normalize customer data, such as purchase history or behaviour, in order to segment customers effectively. This can be used for targeted advertising, such as sending personalized offers to customers who have purchased similar items in the past.
Image and Voice Recognition
In image recognition, the normalization technique is used to convert the pixels’ values of the images into a scale of 0 to 1, to ensure that each pixel has equal importance in the algorithm. In voice recognition, the normalization technique is used to ensure that the audio samples have equal loudness and frequency before being processed.
Climate Data Analysis
Data normalization is used in climate data analysis to normalize data obtained from different sources, such as temperature and precipitation data, which can be measured in different units or over different time intervals. Normalizing the data allows scientists to make accurate comparisons of climate data from different regions.
Conclusion
In conclusion, data normalization is essential for data scientists to ensure that their data is consistent, accurate, and easy to interpret. Without normalization, data could be like a wild animal, running around freely without any rules or structure.
Just like a well-trained pet, normalization tames the data and makes it more obedient and easier to work with.
There are several normalization techniques, each with its own strengths and weaknesses. It's like choosing the right tool for the job, just like you wouldn't use a hammer to fix a broken computer (unless you hate your computer).
So whether you're in finance, medical research, marketing, or any other field dealing with data, normalization is a crucial technique to ensure your data is reliable and accurate.
Just remember, don't let your data run wild like a herd of stampeding elephants. Normalize it like a well-behaved poodle.
Recommended Courses


Machine Learning Course
Rating: 4.5/5


Deep Learning Course
Rating: 4/5


NLP Course
Rating: 4/5
